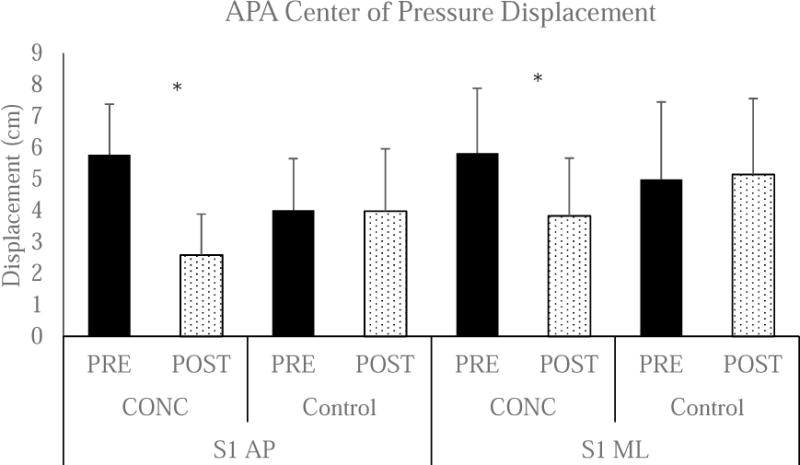
Figure 2. Center of Pressure Displacement during the APA.

There was a significant Group by Time interaction for S1 AP (P<0.001). *Post-hoc testing identified a signification reduction in CONC (PRE: 5.7 ± 1.6 cm and POST: 2.6 ± 2.1 cm, P<0.001), but no difference in Control (PRE: 4.0 ± 1.6 cm and POST: 4.0 ± 2.5 cm, P=0.921). There was also a significant Group × Time interaction for S1 ML (P<0.001). Post-hoc testing identified a significant reduction in CONC (PRE: 5.8 ± 2.1 cm and POST: 3.8 ± 1.8 cm, P<0.001), but no difference in Control (PRE: 5.0 ± 2.5 cm and POST: 5.2 ± 2.4 cm, P=0.485).
