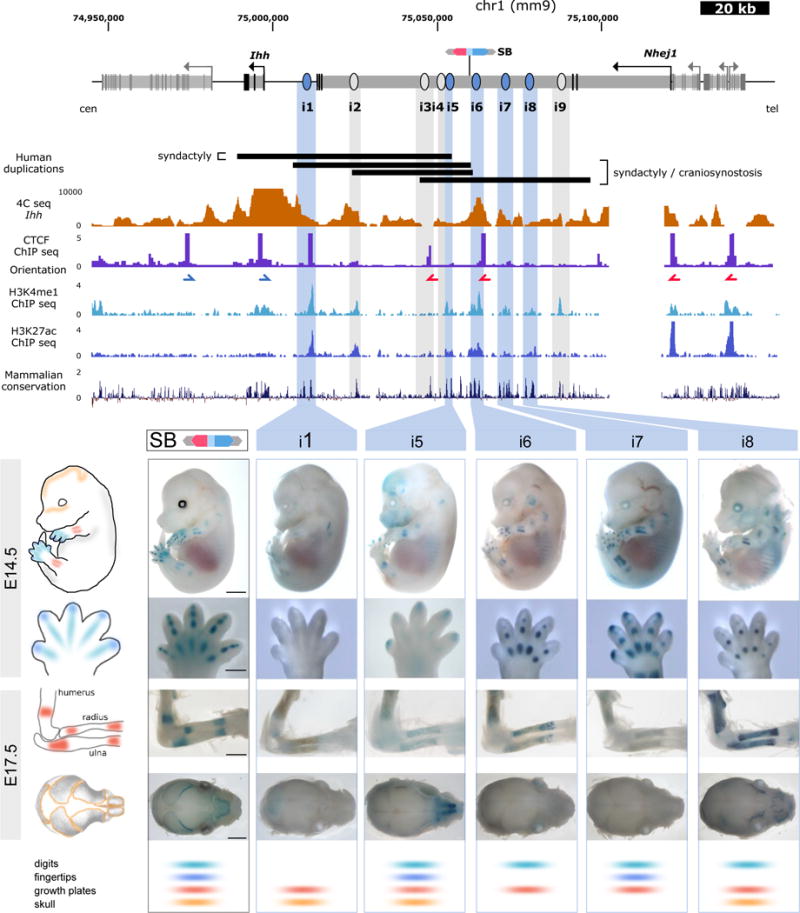
Figure 1. A cluster of enhancers interacts with the Ihh promoter during mouse development.

Above, close-up of the Ihh genomic region. Genes and their transcription start sites are indicated, exons are shown in black, introns in light grey. The position of the LacZ reporter insertion is indicated (SB). Black bars indicate the size and position of previously described human duplications1,2 converted to the mouse genome. 4C-seq performed in E14.5 limbs using the Ihh promoter as viewpoint is shown below. Note increased interactions with intron 3 of the adjacent Nhej1 gene (see also Supplementary Fig. 1). CTCF ChIP-seq performed in E14.5 limbs is shown (ENCODE)3 and blue/red arrows indicate motif orientation. Additional tracks below show H3K4me1, H3K27ac, as well as conservation. This information was used to predict enhancers i1–i9, indicated by light blue and gray bars. Below, transgenic reporter assay (LacZ) of elements positive at E14.5 and E17.5 (marked in light blue; panel displays embryos and handplates at E14.5 and dorsal view of forelimbs and top view of skulls at E17.5). Regulatory activity of the region as indicated by the inserted LacZ reporter (SB, black outline) is shown on left. Lower panel shows scoring of each element for tissue-specificity. Elements negative at E14.5 but with positive staining at E17.5 are marked in gray and shown in Supplementary Fig. 3. Scale=2000μm (embryos/skulls), 500μm (handplates) and 1000μm (forelimbs).
