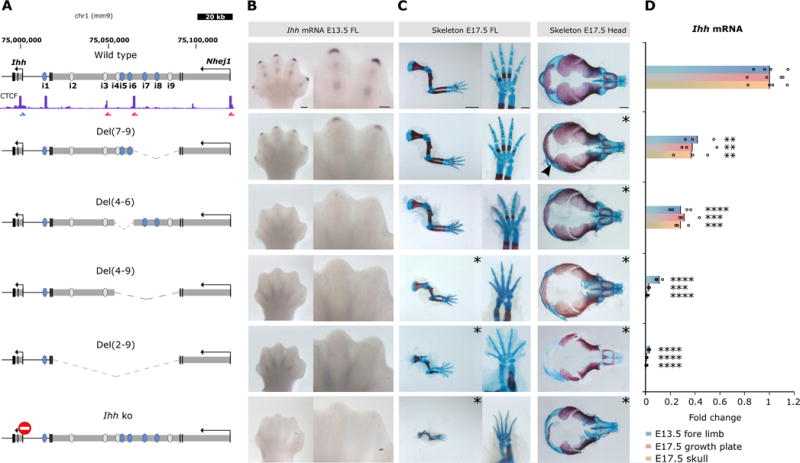
Figure 2. Deletions of regulatory elements reveal additive control of Ihh expression.

(A) Deletions generated by CRISVar21 at the locus. Ihh knockout is shown for comparison (stop signal). CTCF ChIP-seq performed in E14.5 limbs is shown (ENCODE)3 and blue/red arrows indicate motif orientation. Deleted chromosomal region is represented as dotted line. Note that Del (4–9) and Del(7–9) delete only 1 intronic CTCF site, maintaining another intact. (B) In situ hybridization shows Ihh expression in handplates (E13.5). Note expression in digit tips and condensing digits in wt and loss of expression in all deletions containing enhancer i5. Scale bar=200 μm (handplates). (C) Skeletal stainings of forelimbs, autopod and skull (E17.5). Mutants displaying abnormal phenotypes are indicated by asterisks. Both, Del(2–9) and Del(4–9) result in massive reduction of limb size and reduced ossification similar to Ihh ko, whereas Del(4–6) and Del(7–9) mice did not show noticeable limb abnormalities. All studied mutants displayed skull defects (delayed ossification), an effect less prominent in Del(7–9) mutants (arrowhead). Scale bars=2000μm (forelimbs), 500μm (autopods) and 1000μm (skulls). (D) Ihh qPCR analysis in E13.5 forelimb, E17.5 growth plate (elbow) and skull. Deletion of intron 3 of Nhej1 encompassing enhancers i2–i9 resulted in almost complete loss of Ihh expression in all tissues, whereas smaller deletions reduce expression partially. Bars represent mean of n ≥ 3 different individuals (circles). *P< 0.05; **P < 0.01; ***P < 0.001; ****P < 0.0001; ns, not significant.
