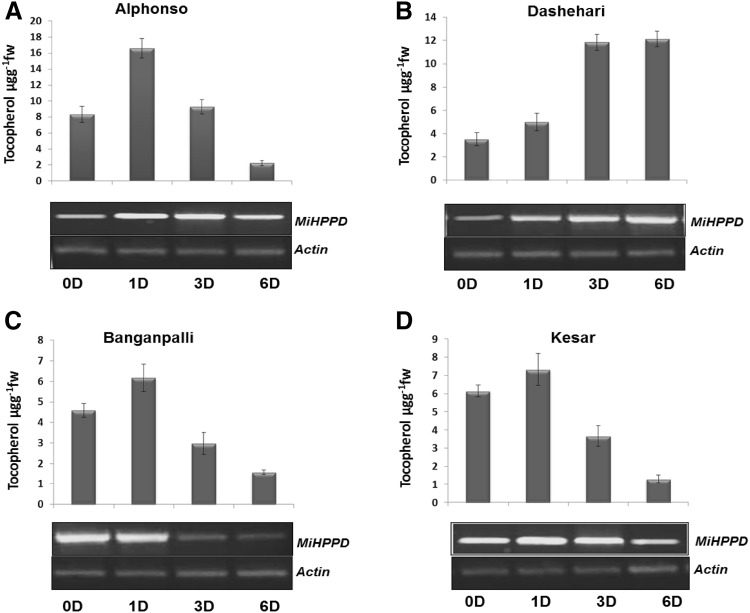
Fig. 3.
Tocopherol levels and corresponding MiHPPD expression in 4 different varieties of mango a Alphonso, b Dashehari, c Banganpalli and d Kesar. Upper panel shows tocopherol levels while lower panel shows MiHPPD gene expression during ripening in different varieties (0D–6D, represents days after ethylene treatment). For tocopherol three independent extractions were analyzed from pulp obtained from pool of 4–5 mangoes. Data were analysed and expressed as mean ± standard deviation. Content was measured in μgg−1 fw

