Fig. 4.
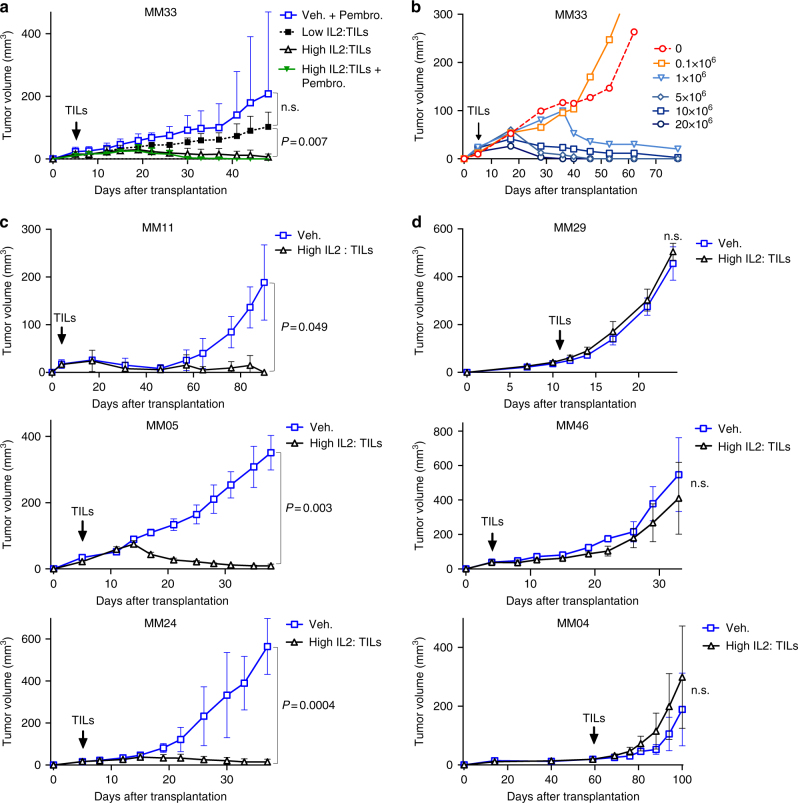
ACT in mice with high levels of plasma hIL-2 correlates with responses in patients. a Tumor growth curves of MM33 in hIL2-NOG mice expressing high (>2 ng/ml) or low levels of hIL-2 (< 1.5 ng/ml), treated either with PBS or TILs in the presence or absence of pembrolizumab. b Dose titration response of MM33 to different amounts of injected TILs (from 0.1×10⁶ to 20×106 TILs) in hIL2-NOG mice with high levels of hIL2. c, d Tumor growth curves of cells from three responders in the clinic (c: MM11, MM24 and MM05) and from two non-responders (d: MM04, MM46 and MM29) in hIL2-NOG mice with high levels of hIL-2 treated either with PBS or TILs. Data are caliper measurements (MM33/MM24/MM05/MM04, n = 4 per group; MM11/MM29/MM46, n = 3 per group). P-values are from multiple t-test (with Sidak corrections) for tumor growth curves. Experiment in a was performed twice, a replicate shown in Supplementary Fig. 5. Experiments in b, c were performed once except for MM24 where a replicate experiment is shown in Supplementary Fig. 5

