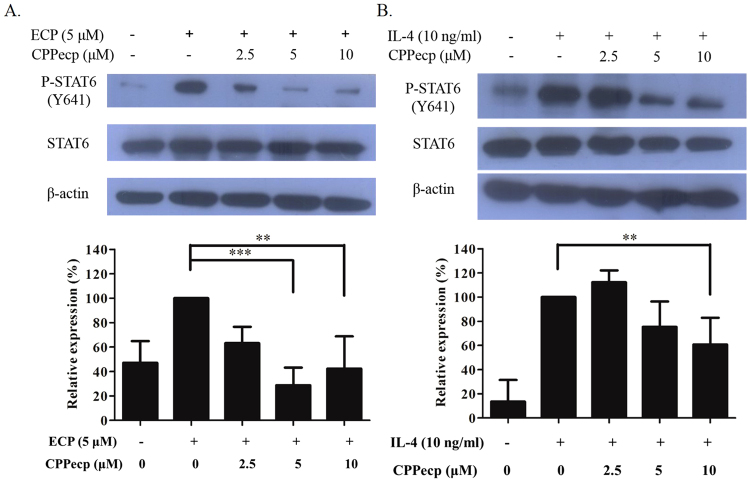
Figure 3.
(A) CPPecp decreases ECP stimulated STAT-6 phosphorylation in BEAS-2B cells. BEAS-2B cells were treated with 5 μM ECP alone and in the absence or presence of CPPecp at 2.5, 5 and 10 μM for 15 min. Upper panel: Changes in protein levels of p-STAT6/STAT6 were determined by Western blotting. Lower panel: Intensity of protein band from control and treated cells was normalized to β-actin signal and the difference in protein expression at each concentration was expressed as percentage of p-STAT6 level stimulated by 5 μM ECP. Values are expressed as mean ± SD for three experiments. ***p < 0.001, **p < 0.01. (B) CPPecp decreases IL-4 stimulated STAT-6 phosphorylation in BEAS-2B cell. BEAS-2B cells were treated with 10 ng/ml IL-4 alone and combined both 10 ng/ml IL-4 and 2.5, 5 and 10 μM CPPecp for 5 min. Upper panel: Changes in protein levels of p-STAT6/STAT6 were determined by Western blotting. Lower panel: Intensity of protein band from control and treated cells was normalized to β-actin signal and the difference in protein expression at each concentration was expressed as percentage of p-STAT6 level stimulated by 10 ng/ml IL-4. Values are expressed as mean ± SD for three experiments. **p < 0.01.

