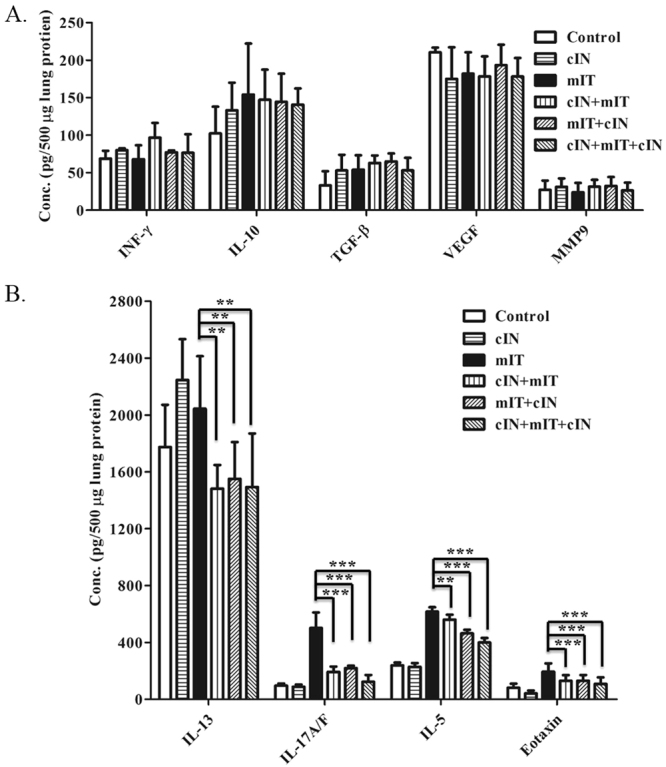
Figure 6.

(A) Levels of IFN-γ, IL-10, TGF-β, VEGF, MMP9 in lung protein extracts. There was no difference among these cytokines six treatment groups. (B). Levels of IL-13, IL-17A/F, IL-5, and eotaxin levels in lung protein extracts. All values were compared with the mIT groupcIN + mIT, mIT + cIN, and cIN + mIT + cIN groups all had lower concentrations of IL-13 (all p = 0.004), IL-17A/F (all p < 0.000001), and eotaxin (p = 0.0007, 0.0008, and 0.0003, respectively). IL-5 levels were ower in mIT + cIN and cIN + mIT + cIN groups (p < 0.000001) as well as cIN + mIT group (p = 0.01). **p < 0.01, ***p < 0.0001.
