Figure 8.

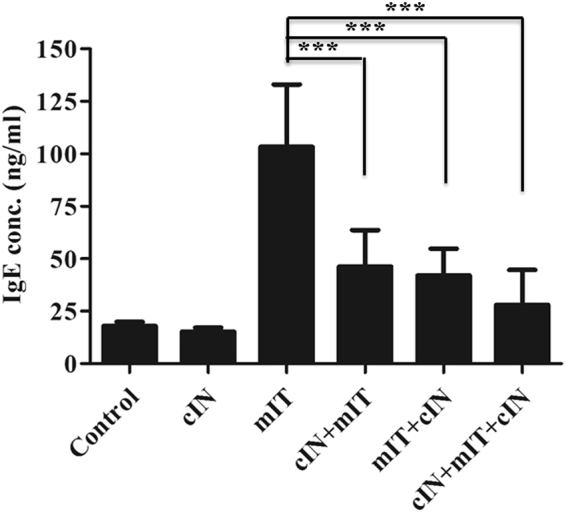
Serum Der p-specific IgE level on day 23 from mice in six groups. The mIT group had a higher Der p- specific IgE level than did the cIN + mIT, mIT + cIN, and cIN + mIT + cIN groups on day 23. *p < 0.05, **p < 0.01, ***p < 0.0001.

Serum Der p-specific IgE level on day 23 from mice in six groups. The mIT group had a higher Der p- specific IgE level than did the cIN + mIT, mIT + cIN, and cIN + mIT + cIN groups on day 23. *p < 0.05, **p < 0.01, ***p < 0.0001.