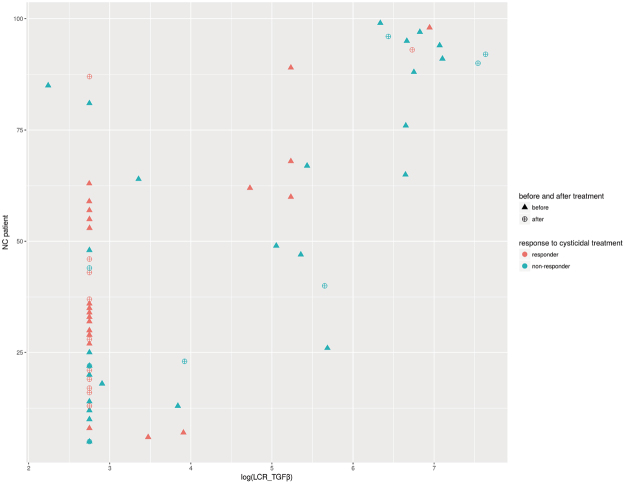
Figure 6.
Correlation between cerebrospinal fluid TGFβ levels with the reduction in parasite size or number in responder and non-responder NC patients, before and after treatment. Individual logarithmic TGFβ levels before (triangle) and after (circle) treatment. Response to treatment was monitored by axial computed tomography (TAC). Patients were classified either as responders (orange circle) when the reduction in parasite size or number was higher than 50%, or non-responders (blue circle) when parasite load reduction was less than 50%.

