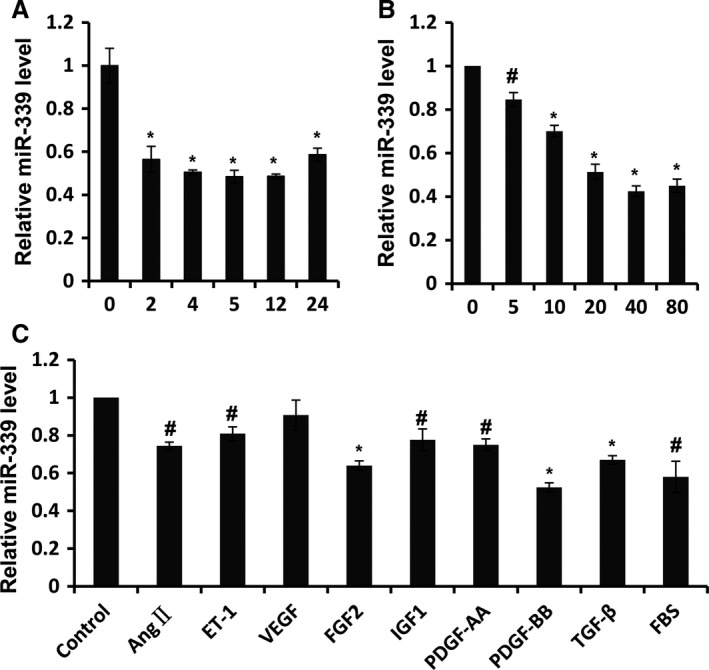
Figure 2.

MiR‐339 was downregulated PDGF‐BB. (A) RPASMC was treated with PDGF‐BB for time indicated and qRT‐PCR was performed to assess the abundance of miR‐339, n = 3, *P < 0.01 versus 0 h. (B) RPASMC was exposed to PDGF‐BB with dose indicated for 12 h and qRT‐PCR was performed to detect the abundance of miR‐339, n = 3, #P < 0.05, ** P < 0.01 versus 0 ng/mL. (C) RPASMC was treated with cytokines or growth factors indicated for 12 h and the expression of miR‐339 was determined via qRT‐PCR, n = 3, #P < 0.05, *P < 0.01 versus control.
