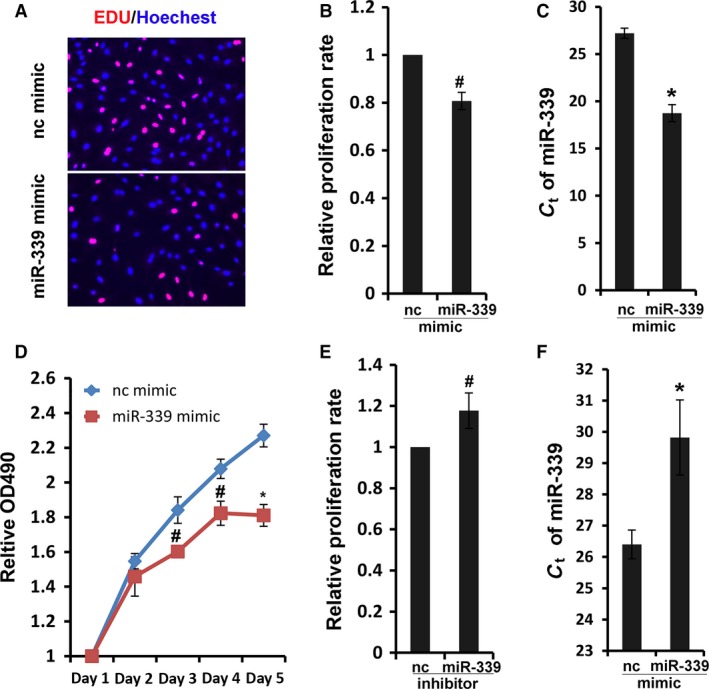
Figure 4.

MiR‐339 inhibited RPASMC proliferation. (A) RPASMC transfected with miR‐339 or control mimic for 72 h were incubated with EdU solution for 4 h, and then were fixed and stained with Apollo dye (red) and Hoechest (blue). (B) Bar charts showing relative EdU incorporation rate in RPASMC, n = 4, #P < 0.05 versus control mimic. (C) Quantification of miR‐339 level was assessed in transfected RPASMC with qRT‐PCR, *P < 0.01 versus control mimic. (D) Proliferation of RPASMC infected with control or miR‐339 mimic was determined using MTS assay, n = 4, # P < 0.05, *P < 0.01 versus control mimic. (E) Proliferation of RPASMC infected with control or miR‐339 inhibitors was determined via EdU incorporation assay, n = 4, #P < 0.05 versus control mimic. (F) Quantification of miR‐339 level was determined in transfected RPASMC with qRT‐PCR *P < 0.01 versus control inhibitor.
