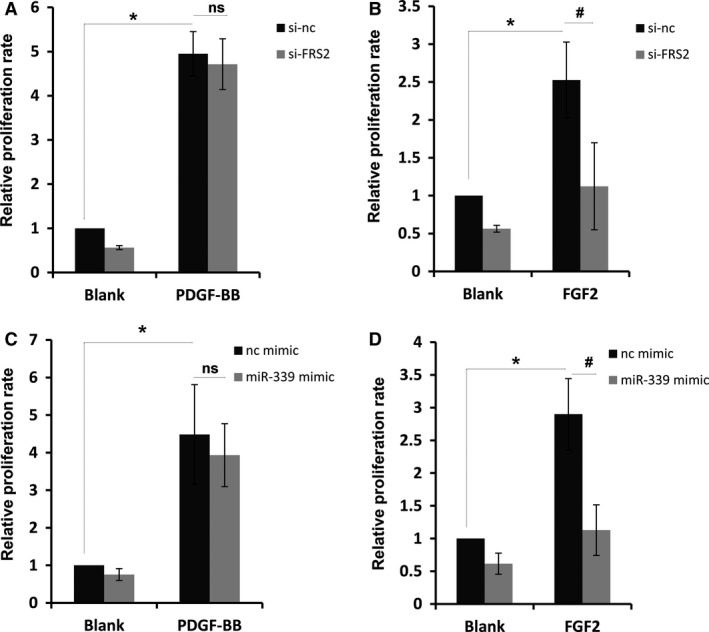
Figure 6.

MiR‐339 repressed FGF2‐induced proliferation. RPASMC transfected with si‐FRS2 or control siRNA for 72 h was starved for 12 h, then PDGF‐BB (A) or FGF2 (B) was added for 12 h. Proliferation rate of RPASMC was determined with EdU incorporation assay. n = 3, #P < 0.05, *P < 0.01, comparing indicated group, ns represents no significance. RPASMC transfected with miR‐339 or control mimic for 72 h was starved for 12 h, then PDGF‐BB (C) or FGF2 (D) was added for 12 h. Proliferation rate of RPASMC was determined with EdU incorporation assay. n = 3, #P < 0.05, *P < 0.01, comparing indicated group, ns represents no significance.
