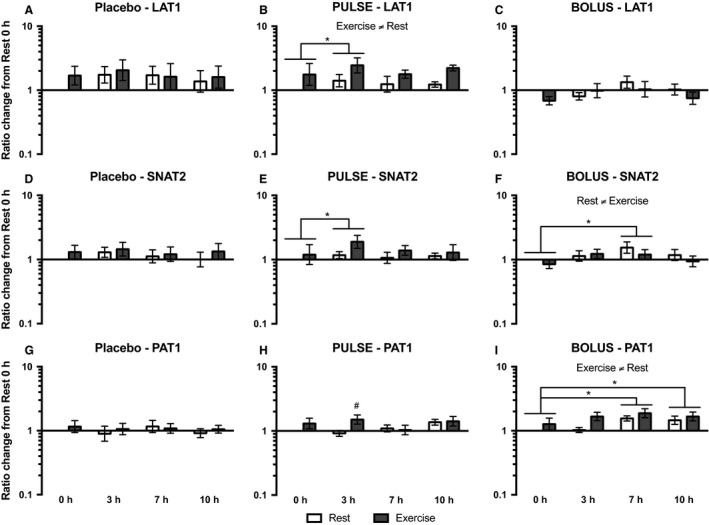
Figure 5.

LAT1 (A, B, and C), SNAT2 (D, E, and F), and PAT1 (G, H, and I) protein expression in the placebo, PULSE , and BOLUS groups, respectively, for the resting leg (white bars) and exercised leg (dark gray bars) at 0, 3, 7, and 10 h postexercise. Data are expressed as changes from 0 h in the resting leg. Data are shown as the GeoMean ± back‐transformed SEM. *Differences between time points. #Different from the resting leg.
