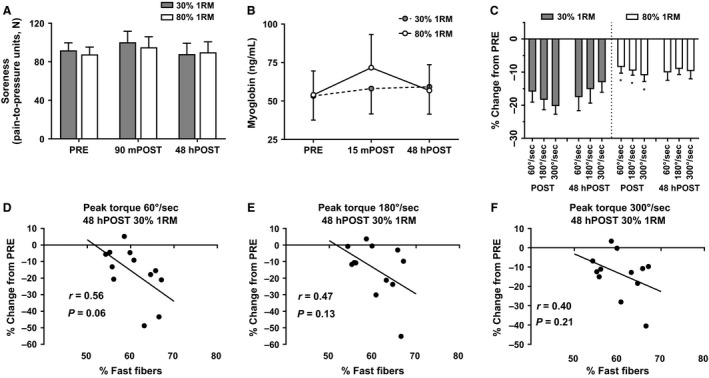
Figure 5.

Soreness, myoglobin, and isokinetic dynamometry data. (A) The change in soreness measured by algometry. (B) The change in serum myoglobin. (C) The percent change in peak torque at each velocity at POST and 48hPOST each condition, relative to PRE. All data are presented as mean ± SE (n = 10 per bar for serum myoglobin and n = 11 per bar for isokinetic dynamometry). (D–F) The relationship between the percentage of fast‐twitch fibers and percent change in peak torque at each velocity 48hPOST light RE, relative to PRE. * indicates a significant between‐condition difference (P < 0.05).
