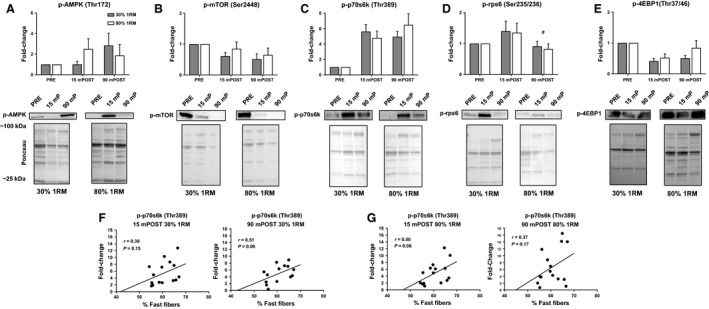
Figure 7.

Muscle phosphoprotein expression. (A–E) The fold change in each phosphoprotein. All data are presented as mean ± SE (n = 13 per bar). Beneath each bar graph, representative images of the magnitude of fold change are pictured. (F, G) The relationship between p‐p70s6k expression at 15mPOST and 90mPOST each condition and the percentage of fast‐twitch fibers. # indicates significant time effect whereby values were significantly less than baseline regardless of load condition (P < 0.05).
