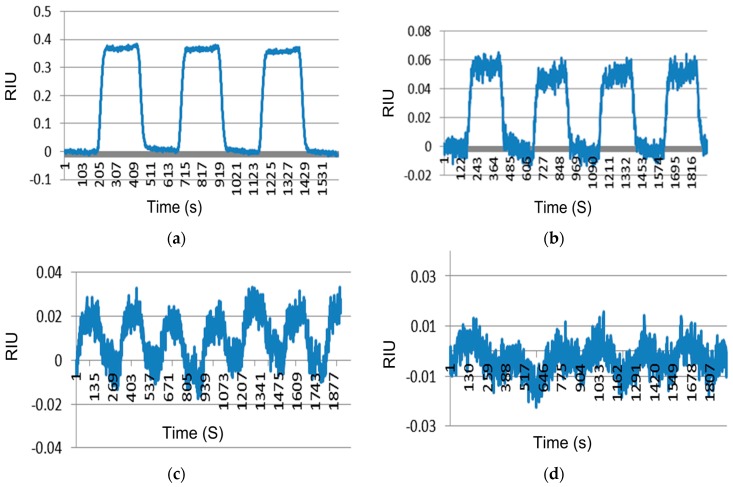
Figure 4.
SPR sensorgrams of heavy water. SPR response to the concentration of D2O at (a) 2.2% of D2O as 100 refractive index units (RIU); (b) 0.22% of D2O as 10 RIU; (c) 0.022% of D2O as 1 RIU and (d) 0 of D2O (pure water) as a blank. X axis represents time in seconds and Y axis represents RIU signal in all the above sensorgrams.

