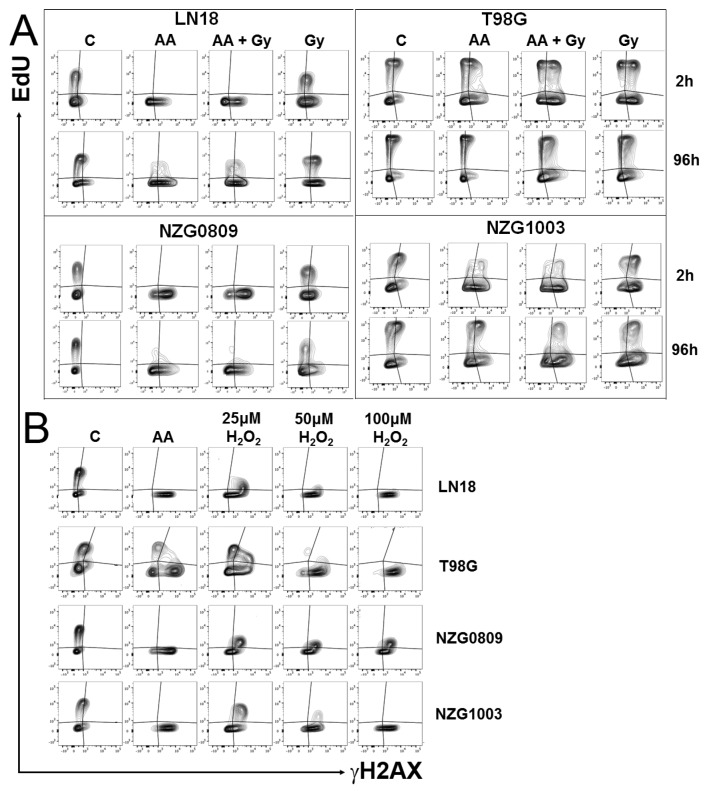
Figure 4.
DNA synthesis indicated by EdU incorporation (y-axis) versus DNA damage by γH2AX foci (x-axis). Cells were treated as indicated and harvested after 2 h (A and B) or 96 h (A). (B) Effect of a 1 h exposure to 5 mM AA compared with that of different concentrations of H2O2. Flow cytometry plots are representative of at least three independent experiments.

