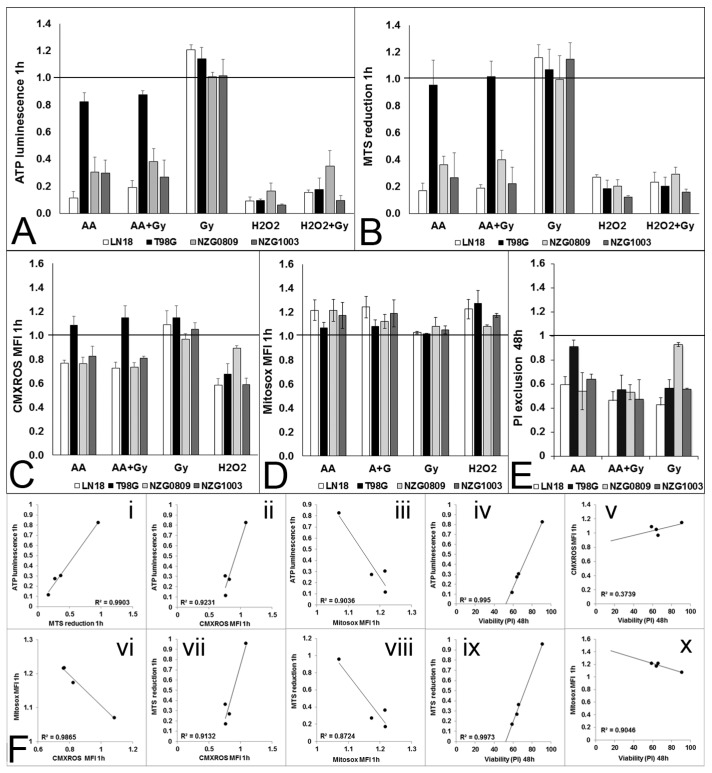
Figure 5.
Metabolic stress after 1 h exposure to 5 mM AA, 6 Gy, 5 mM AA + 6 Gy and 500 μM H2O2 compared to untreated controls (set at 1). (A) Cellular ATP levels measured by luminescence; (B) Cellular NADH flux measured by MTS reduction; (C) Mitochondrial membrane potential measured by CMXROS; (D) Mitochondrial superoxide production measured by Mitosox. (E) Viability measured as PI exclusion 48 h after treatments. Fold change compared with untreated control cells. ATP luminescence, MTS reduction and CMXRos MFI were all significantly higher after 6 Gy treatment compared with all other treatments for LN18, NZG0809 and NZG1003. Viability after 5 mM AA treatment was significantly higher for T98G and after 6 Gy treatment for NZG0809. (p < 0.05: un-paired two-tailed student t-test). Values are averages ± SEM of at least 3 independent experiments in triplicate. (F) Correlations between cellular ATP levels, MTS reduction, mitochondrial membrane potential, mitochondrial superoxide production (all at 1 h) and cell viability at 48 h. Each dot represents one of the four cell lines.

