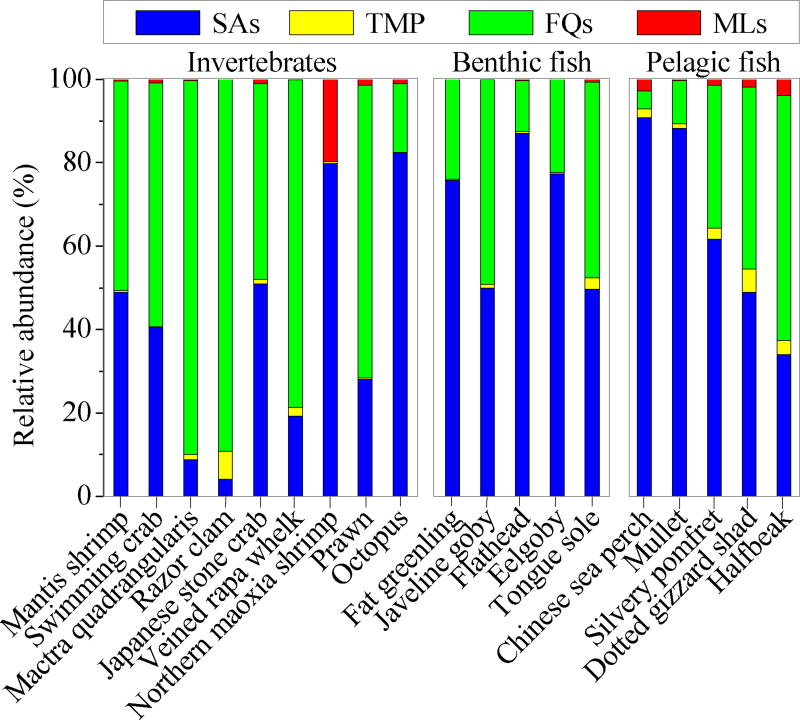
Figure 1.
Abundance profiles of different antibiotic classes (percentage of the total measured concentrations) reveal significant differences among invertebrates, benthic fish and pelagic fish. SAs, TMP, FQs and MLs represent sulfonamides, trimethoprim, fluoroquinolones and macrolides, respectively.

