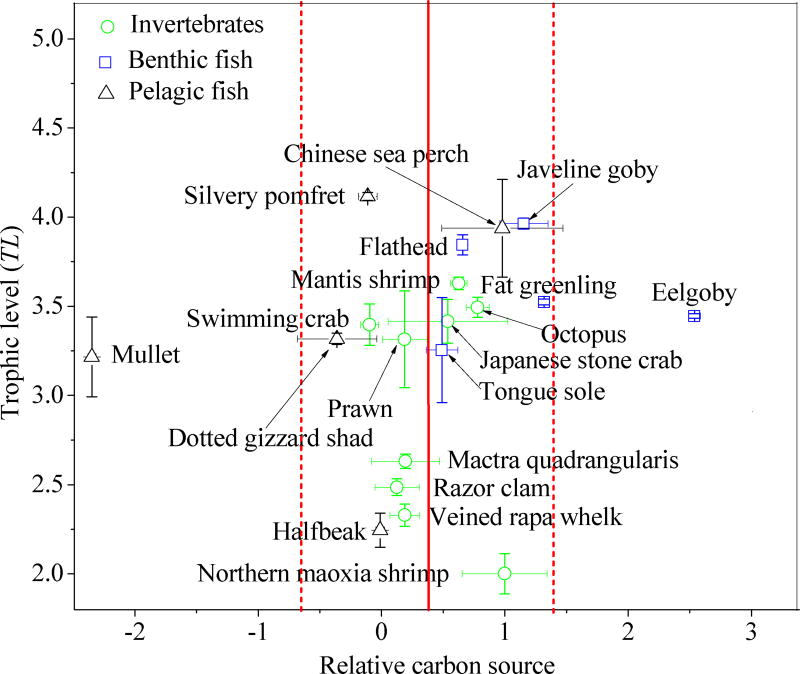
Figure 2.
Relative carbon sources and trophic levels (TL) characterize the food web relationships of the species collected from Laizhou Bay. Green circles (
 ), blue diamonds (
 ) and black triangles (△) represent invertebrates, benthic fish and pelagic fish, respectively. Data are presented as mean ± one standard deviation of relative carbon sources (n = 3) and TL values (n = 3). The red vertical solid line and dotted lines represent the mean value of relative carbon sources for all species and the boundaries of relative carbon sources for species in the same food web.32

