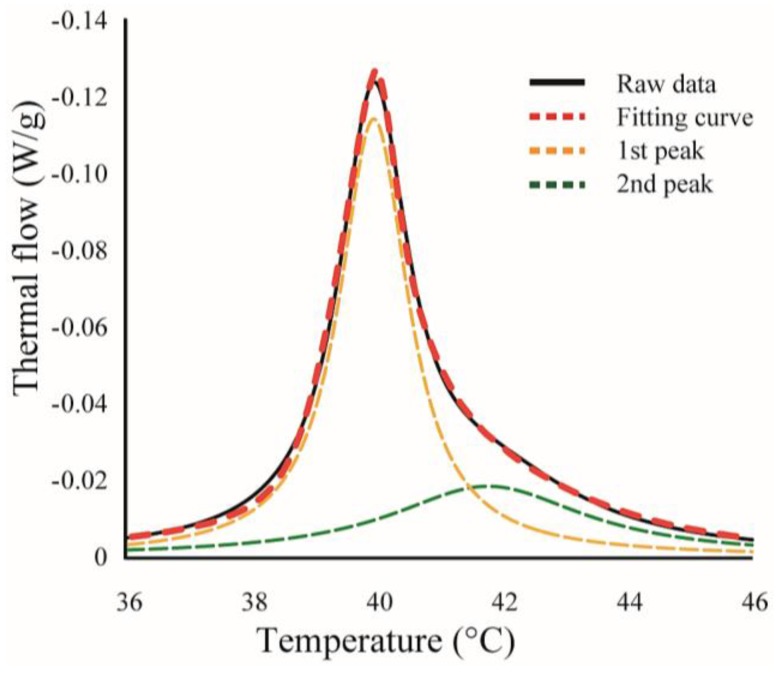
Figure 2.
An example for curve fitting. Black-solid and red-dashed lines indicate experimental data and calculated fitting curve, respectively. Yellow- and green-dashed lines are the curves for two independent transitions, and the sum of these curves corresponds to the calculated fitting curve (red-dashed line).

