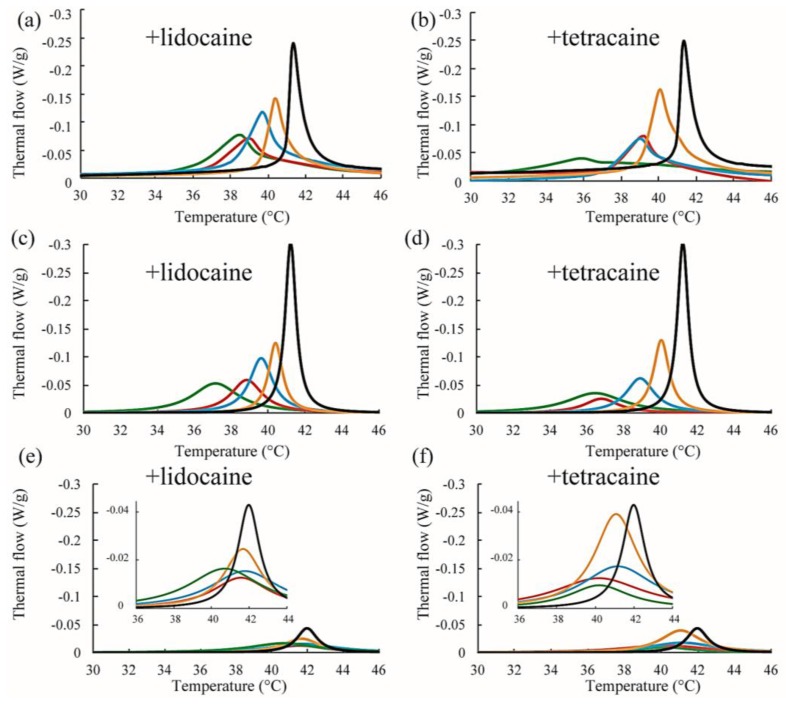
Figure 7.
(a,b) Representative DSC thermographs of DPPC/Chol/lidocaine and DPPC/Chol/tetracaine membranes, respectively. Black, orange, blue, red, and green lines indicate LA at 0, 2.5, 5, 7.5, and 10 mol %, respectively; (c,d) Stronger peaks obtained from peak deconvolution in DPPC/Chol/lidocaine and DPPC/Chol/tetracaine membranes, respectively; (e,f) Weaker peaks obtained from peak deconvolution in DPPC/Chol/lidocaine and DPPC/Chol/tetracaine membranes, respectively. Insets show magnifications of the peaks.

