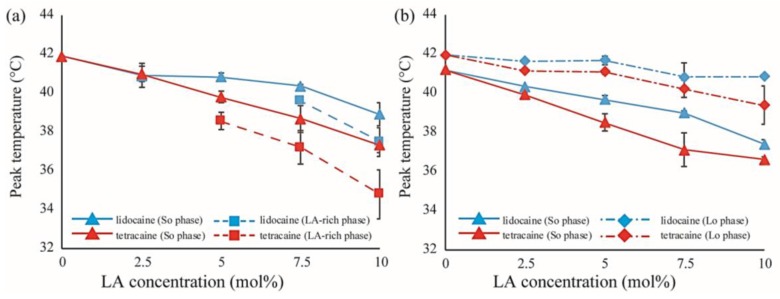
Figure 8.
(a) Shifts in peak temperatures obtained from peak deconvolution of the DSC thermographs in DPPC/LA mixtures as a function of LA concentration. Blue and red lines represent lidocaine and tetracaine-containing membranes, respectively. Solid and dashed lines indicate the temperature shifts of the stronger peak (So phase) and weaker peak (LA-rich phase), respectively; (b) Shifts in peak temperatures obtained from peak deconvolution of the DSC thermographs in DPPC/Chol/LA mixtures as a function of LA concentration. Blue and red lines represent lidocaine and tetracaine-containing membranes, respectively. Solid and dot-dashed lines indicate temperature shifts of the stronger peak (So phase) and weaker peak (Lo phase), respectively.

