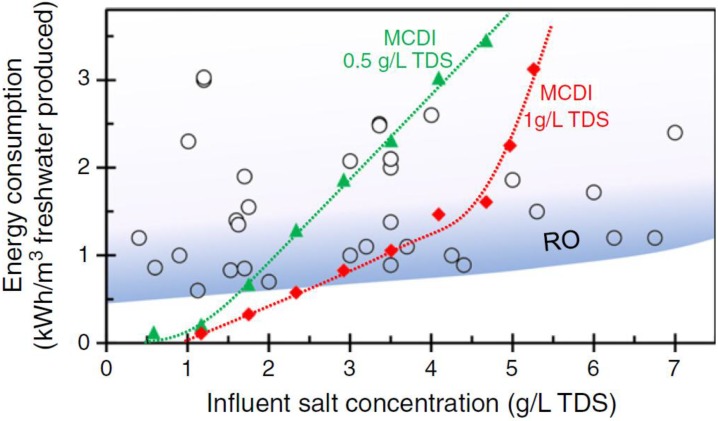
Figure 2.
Comparison of energy consumption between MCDI and reverse osmosis. Triangles: energy consumption of MCDI to bring salt concentration to the level of 0.5 g L−1 Total Dissolved Solids (TDS). Diamonds: energy consumption of MCDI to reduce salt concentration to 1 g L−1 TDS. Circles: energy consumption of Reverse Osmosis (RO) collected from literature studies. Reproduced with permission from [16], copyright Elsvier, 2013.

