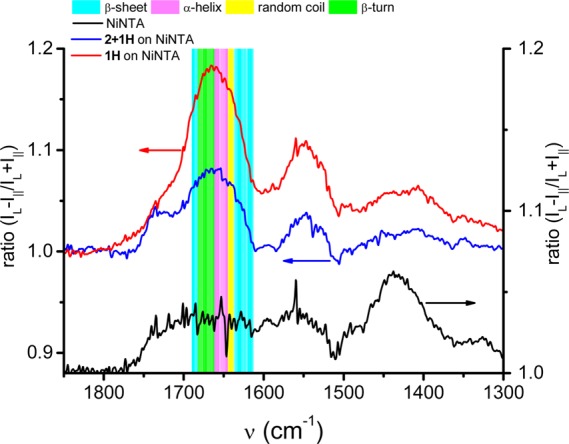
Figure 4.

PM-IRRAS differential reflectance spectra of 1H (red line) and 2 + 1H (blue line) immobilized on Ni2+:NTA SAMs (the black line is the Ni2+:NTA surface prior to protein binding). Colored bands correspond to regions associated with specific secondary structural elements within the amide I region of the protein, and the changes in these bands are used to elucidate protein orientation. Intensities on the y-axis are given as dichroic ratios.
