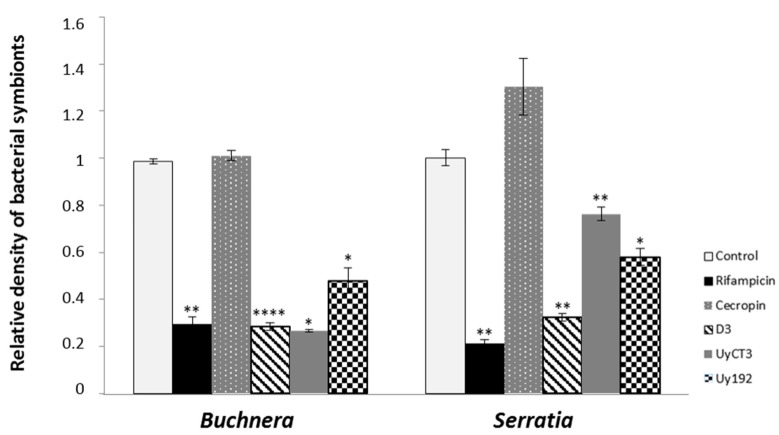
Figure 3.
Quantitative PCR for the detection of Buchnera aphidicola and Serratia symbiotica in the A. pisum after AMP and antibiotic treatments. Data show the relative abundance of symbionts after three days of exposure for representative treatments (left panel = B. aphidicola; right panel = S. symbiotica). Negative control = control AP3 diet; positive control = 50 µg/mL rifampicin; AMP treatments = 250 µg/mL. Statistical significance indicated as follows: * p < 0.05, ** p < 0.01, **** p < 0.0001.

