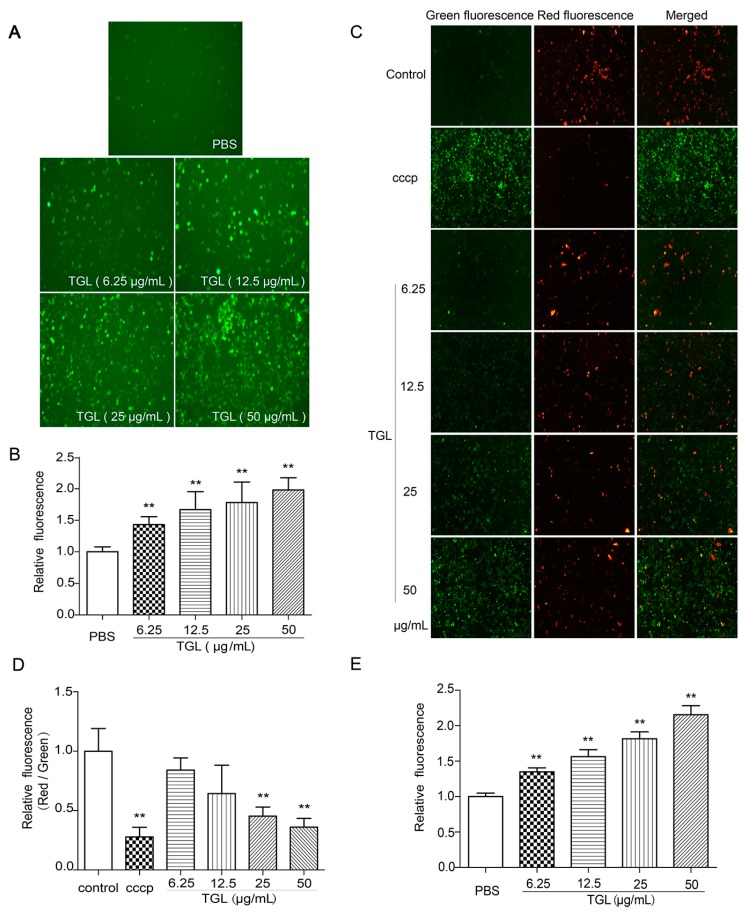
Figure 4.
Variation of (A,B) reactive oxygen species (ROS), (C,D) mitochondrial membrane potential (MMP), and (E) cytosolic free Ca2+ induced by RAW 264.7 cells treated with Typhonium giganteum lectin (TGL) (6.25, 12.5, 25, 50 μg/mL for 1 h). Results are mean ± SD (n = 6). ** p < 0.01 comparing phosphate-buffered saline (t-test). Images were acquired using a microscope, and the intensity was detected using a fluorescence microplate reader. CCCP, carbonyl cyanide 3-chlorophenylhydrazone.

