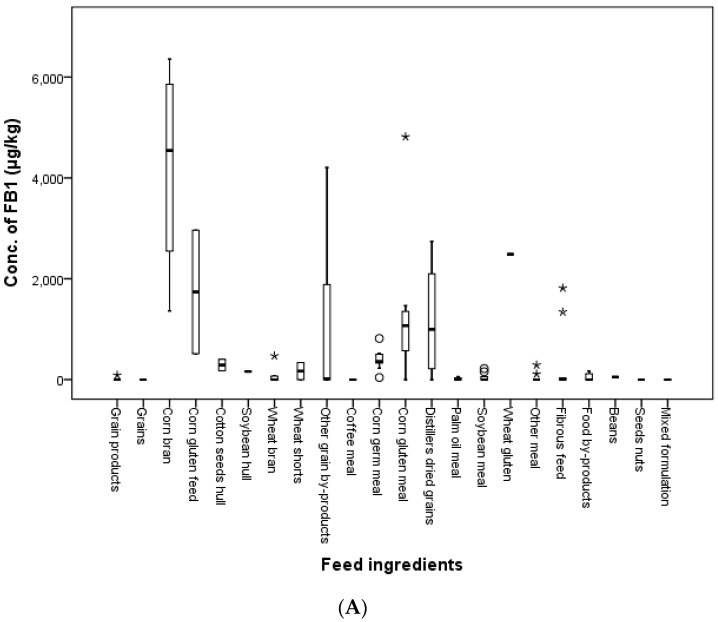
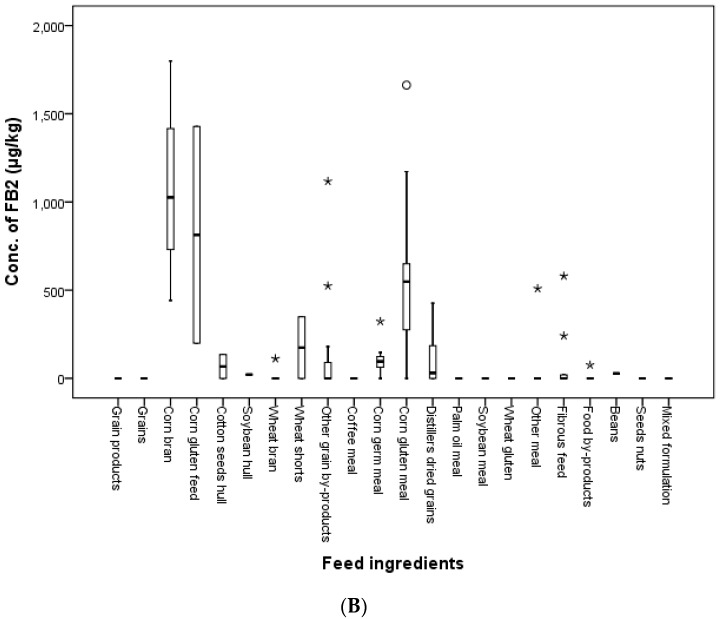
Figure 6.
The distribution of FB1 (A) and FB2 (B) in feed ingredients (box-plot: whiskers at minimum and maximum, box at P25 and P75 with the line at P50; ° values above the 75th percentile plus 1.5-times the inter-quartile distance; * values above the 75th percentile plus 3.0-times the inter-quartile distance; - values mean median value for each feed ingredient).


