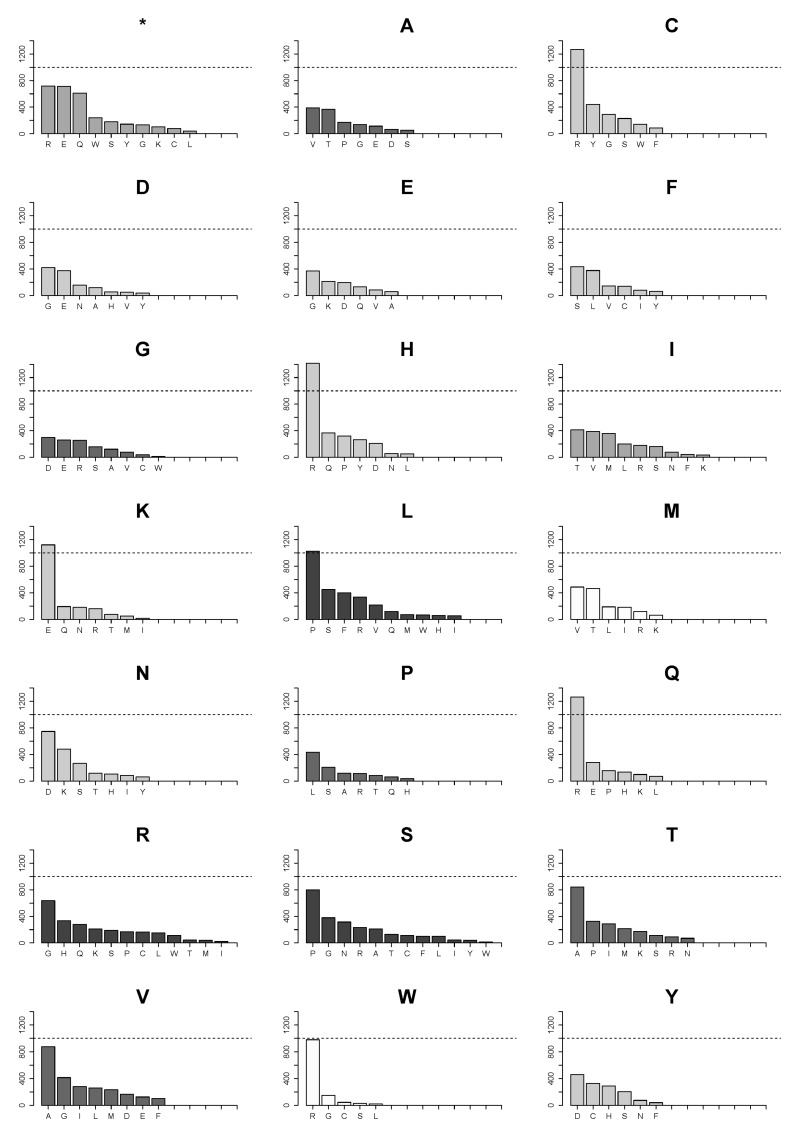
Figure 5.
Landscape of ways of gain of each amino acid in individual substitutions that result in introductions of each of 20 amino acids and a truncation of proteins in mutations in the CCLE database. The dotted horizontal line marks 1000 substitution events. The bars in each graph are colored according to the number of codons for a respective amino acid similarly to the previous graphs. The letter in the title of each graph denotes an amino acid that is gained in mutations.

