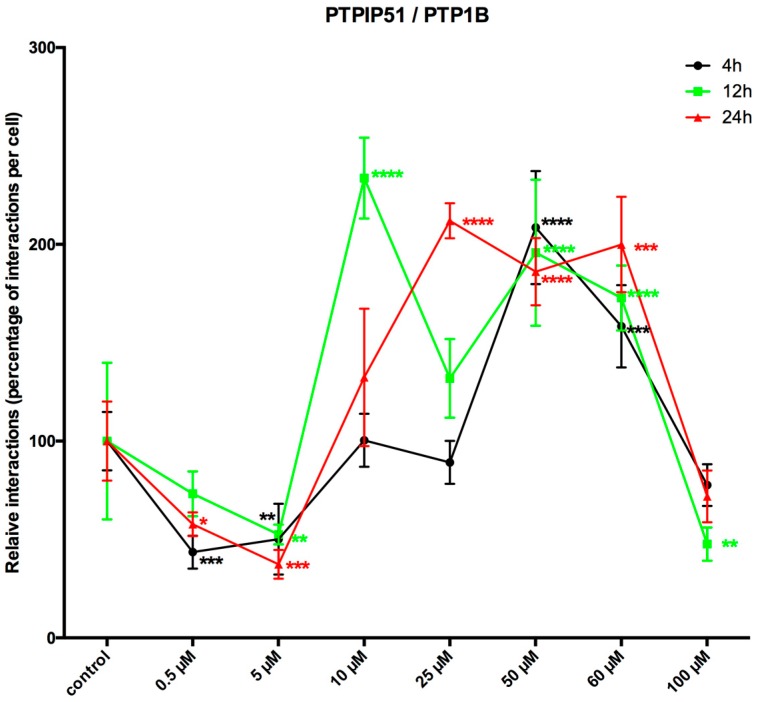
Figure 6.
LDC-3 effects on the time dependent interaction profile of PTPIP51 and PTP1B. Quantitative analysis of the Duolink proximity ligation assay of PTPIP51 and PTP1B (n = 4). The interactions were evaluated by Duolink Image Tool software in untreated controls and in cells treated with 0.5 µM, 5 µM, 10 µM, 25 µM, 50 µM, 60 µM, 100 µM LDC-3, for 4 h, 12 h and 24 h HaCaT cells. The resulting data were analyzed by GraphPad Prism 6 software (GraphPad Software), significance of results tested by Dunnett’s multiple comparisons test. * p < 0.05, ** p < 0.01, *** p < 0.001, **** p < 0.0001.

