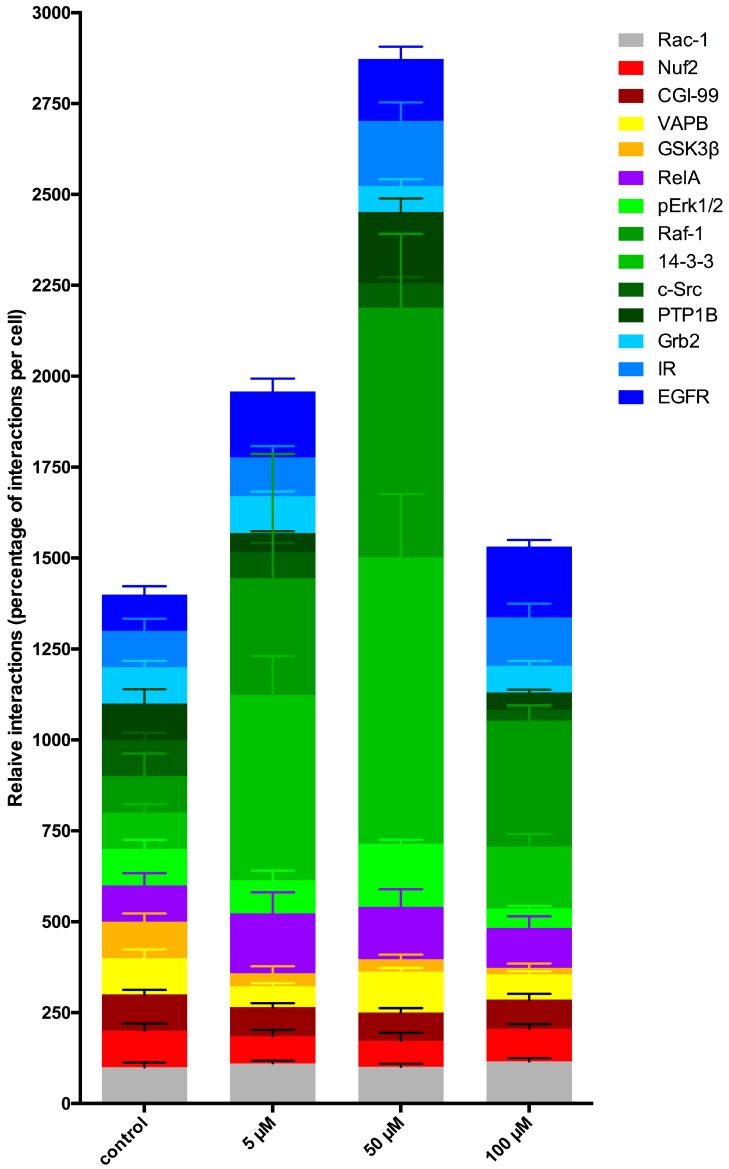
Figure 7.
Cellular protein complex shift of PTPIP51 within 14 protein–protein interactions. Quantitative analysis of the Duolink proximity ligation assay of PTPIP51 with 13 different interaction partners in untreated and LDC-3 treated (5 µM, 50 µM and 100 µM) HaCaT cells (n = 4). The control values of 14 different PTPIP51 protein interactions were equalized to 100% (first stacked column) and the following columns show the standardized interaction values related to the controls (equaling 100%) for the applied LDC-3 concentrations. LDC-3 annuls the known regulatory phosphorylation mechanism of PTPIP51 with significant impact on the assembly of the PTPIP51 associated protein complexes. LDC-3 forces a protein–protein interaction shift of PTPIP51 and stabilizes the protein within MAPK complex on Raf-1 level through the scaffold protein 14-3-3. The remaining members of the PTPIP51 interactome are less affected by the administration of LDC-3. The color code for the single interactions is given at the upper right. The proteins belonging to the same signaling protein complex are coded by graded shades of the same color: blue corresponds to receptor tyrosine kinases and adapter molecules, green corresponds to the MAPK pathway molecules, red corresponds to mitosis associated proteins. For detailed information to the single interaction and their statistics see Figure 6 and supplementary Figures S3 and S4.

