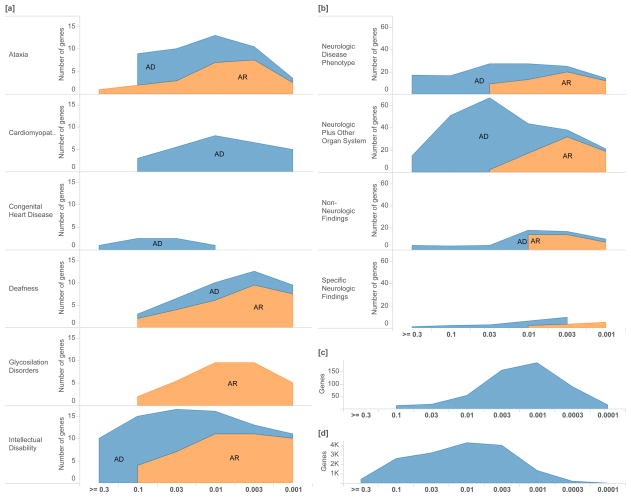
Figure 4.
Distribution of shet values for phenotypes in known disease genes and clinical cases. We plot the distribution of selective effects for different disorder groups, providing information about the breadth and severity of selection associated with each group. [a] We include known Mendelian disease genes (Clinical Genomic Database) annotated as either Autosomal Recessive or Autosomal Dominant and [b] clinical exome sequencing cases21. We contrast these with [c] all tolerated knockouts in a consanguineous cohort (PROMIS)23 and [d] the distribution of selective effects in all scored genes. Logarithmic bins are ordered from greatest to smallest shet values.

