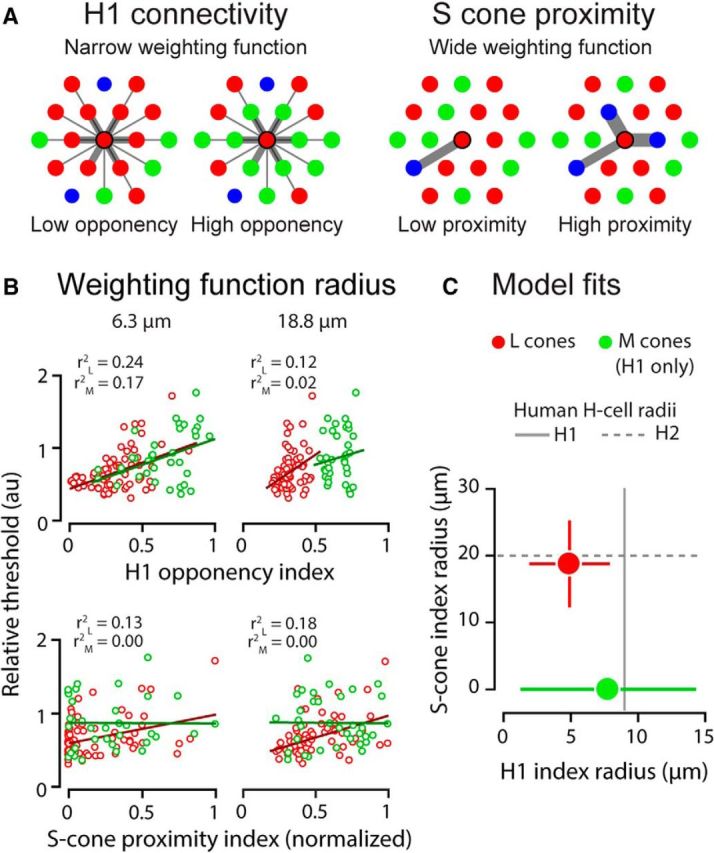
Figure 5.

Preferentially activated neighbors influence single-cone thresholds at a spatial scale consistent with human horizontal cell anatomy. A, Schema of H1 and S cone proximity indices. In these examples, the neighborhood indices are computed for the central L cone in each cluster. Each neighboring cone's contribution to the index is weighted by its proximity to the central cone (width of connectivity lines). For model details, see Materials and Methods. B, L and M cone thresholds plotted as a function of H1 and S-cone proximity indices computed independently for two example radii. Data and regression fits in red are for L cones, those in green are for M cones. C, Optimal H1 and S cone proximity weighting function radii for L and M cone threshold data (red and green circles, respectively). M cone marker is placed at y = 0 because S cone proximity had no effect on thresholds obtained against a long wavelength background. Error bars represent the 95% confidence intervals of the fitted parameters. These radii closely match human H1 and H2 horizontal cell dendritic field dimensions (solid and dashed gray lines, respectively) measured histologically at the same eccentricity (Kolb et al., 1992).
