
Figure 5.
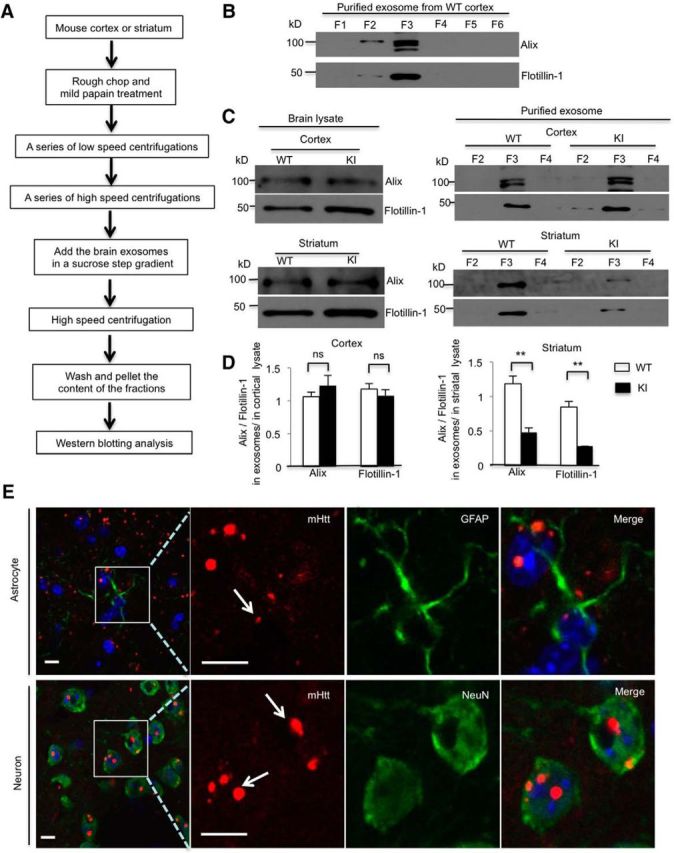
mHtt decreases exosome secretion from HD KI mouse striatum. A, Brain exosome isolation experimental flow chart. B, Western blotting showing that exosome markers, Alix and flotillin-1, are mainly present in F3. C, In the cortex or the striatum, lysates from WT and KI mice, Alix and flotillin-1, were equivalent. However, Alix and flotillin-1 levels significantly decreased in the exosome fraction derived from the HD KI striatum, but not the HD KI cortex compared with WT controls. D, Quantifying ratios of Alix and flotillin-1 in exosomes to those in the cortex or striatal lysates in F3 (cortex, Alix, t = 1.008, df = 4, p = 0.3706; flotillin-1, t = 0.832, df = 4, p = 0.452; striatum, Alix, t = 5.689, df = 4, p = 0.0047; flotillin-1, t = 6.771, df = 4, p = 0.0025; Student's t test, WT and KI, n = 3 mice in each genotype). E, Immunostaining showing nuclei mHtt aggregates in both astrocytes and neurons in 10-month-old HD KI striatum. mHtt (red) was probed by 1C2 antibody. GFAP (green, top) indicates astrocytes, and NeuN (green, bottom) indicates neurons. Top, Arrow indicates the small aggregate in the nucleus of astrocyte. Bottom, Arrows indicate the large aggregates in the nuclei of neurons. **p < 0.01.