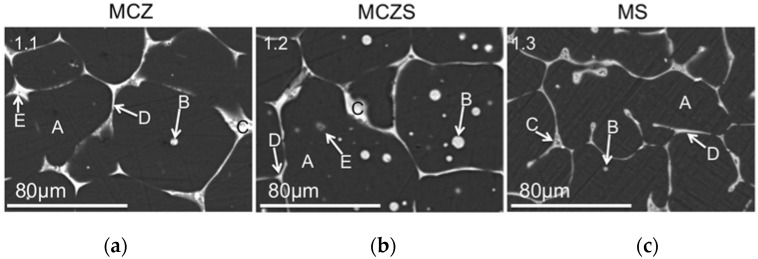
Figure 1.
Backscattered SEM images of the MCZ (a), MCZS (b), and MS (c) alloys after polishing. Elemental mapping of the imaged area was completed (see Figure 2). Regions marked A, B, C, D, and E represent the areas where composition was analyzed using EDS (energy dispersive X-ray spectroscopy). Results of the EDS analysis are presented in Table 1.

