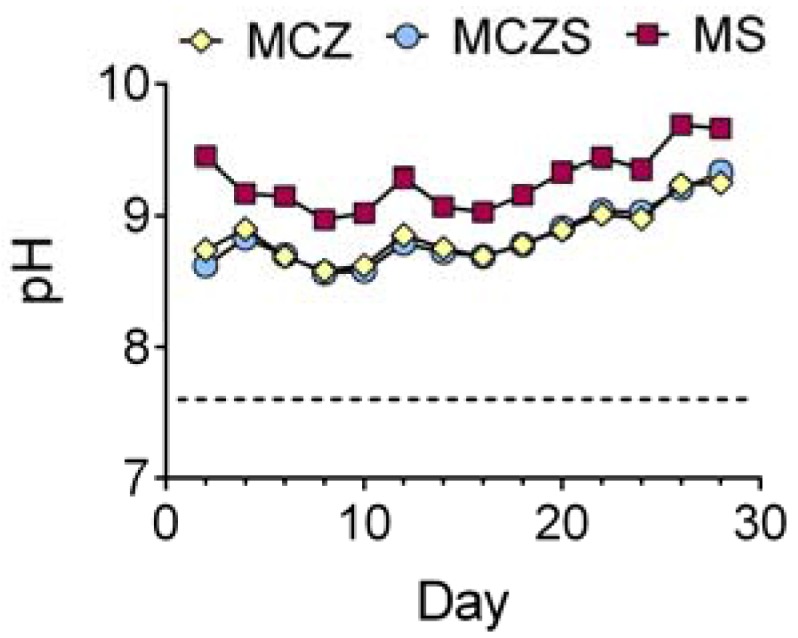
Figure 3.

Trends in pH of the test electrolyte measured at each media exchange every 48 h over the 28 day immersion period. Results are plotted as mean ±1 standard deviation. The dotted line represents the pH of the fresh CCM (cell culture medium) substituted into the chambers during the media exchanges.
