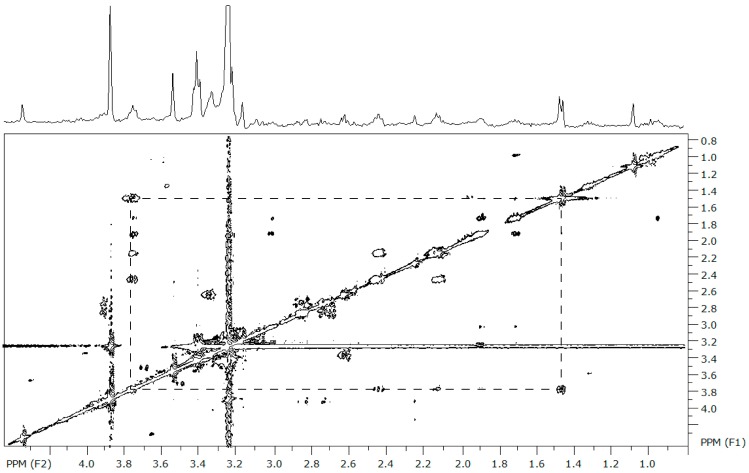
Figure 1.
The representative 2D total correlation spectroscopy (TOCSY) spectrum from Mytilus edulis over 0–5 ppm. The spectrum is referenced to the chemical shift of TSP and the D2O peak was removed. The box on the 2D plot connects the cross-peaks contributed by the resonances of the hydrogen atoms within alanine, where there is a doublet at 1.46 ppm and a triplet at 3.77 ppm. These coupling patterns are used to verify the identity of the compounds in Table 1; the complete list of all coupling partners generated from the TOCSY experiments is provided in Table S1.

