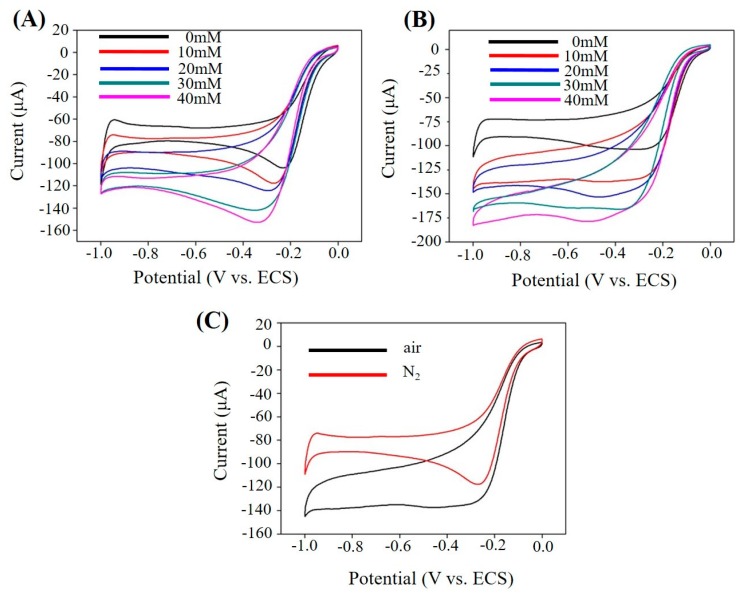
Figure 6.
PAN–PtNPs/GCE for sensing test (scan rate: 50 mV/s, PBS, PH = 7.4): (A) Typical CV curves of PAN–PtNPs/GCE with different H2O2 concentrations under N2 atmosphere; (B) Typical CV curves of PAN–PtNPs/GCE with different H2O2 concentrations under air atmosphere; (C) Corresponding CV curves with the same H2O2 concentration under air and N2 atmosphere.

