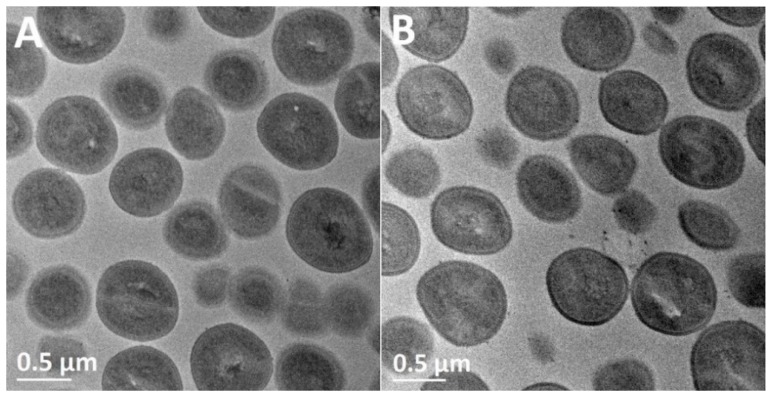
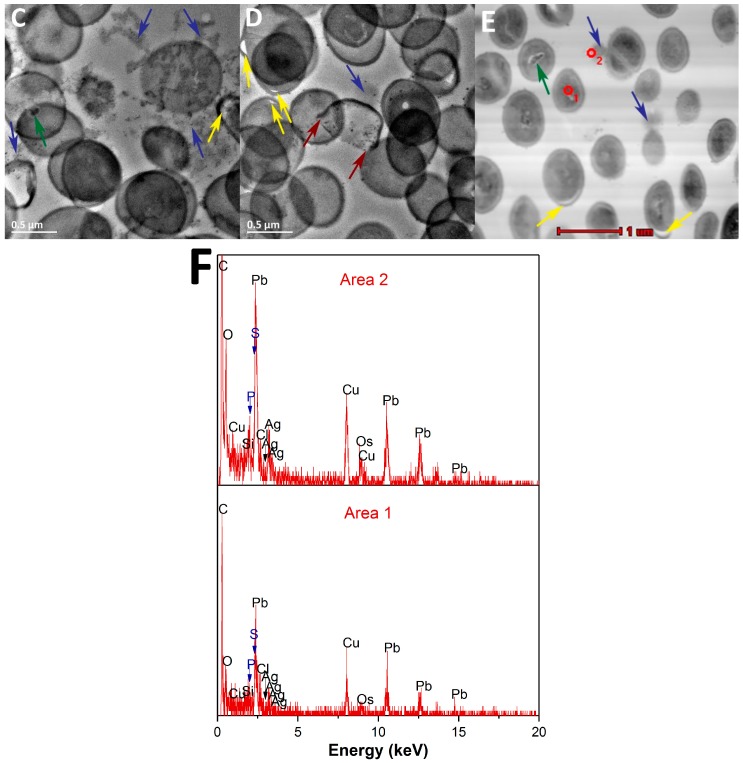
Figure 8.
TEM images of (A) untreated MRSA; (B) MRSA treated with pristine SiO2 NPs; and (C,D) MRSA treated with the Ag–SiO2 composite; (E) HAADF-STEM image of MRSA treated with the composite; (F) The EDX elemental analyses of the selected areas 1 and 2 in panel E. Yellow arrows highlight the gaps between the cell walls and cytoplasmic membranes. Blue arrows show the release of cytoplasmic contents from the bacterial cells. Green arrows demonstrate the central condensation of the bacterial DNA. Red arrows indicate the disruption and loss of bacterial membranes.


