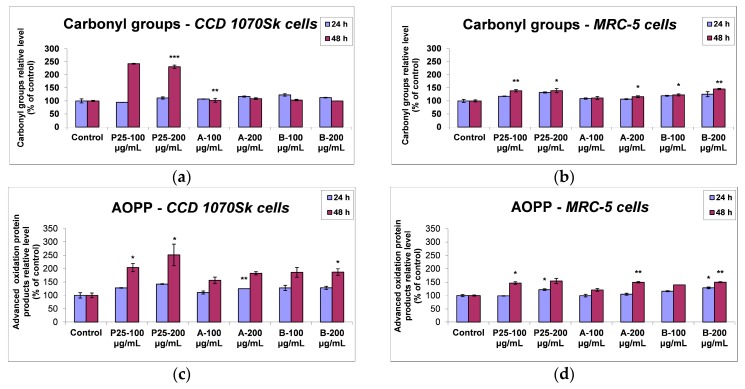
Figure 15.
Protein oxidation profile as shown by carbonyl groups (a,b) and AOPP (c,d) levels in normal skin and lung cells at 24 and 48 h exposure to 100 and 200 μg/mL of the two TiO2/RGO nanocomposites samples (A and B) and commercially available TiO2 NPs (P25). Data are calculated as means ± standard deviation (SD) (n = 3) and showed relative to control (untreated cells). * p < 0.05, ** p < 0.01 and *** p < 0.001 vs. control.

