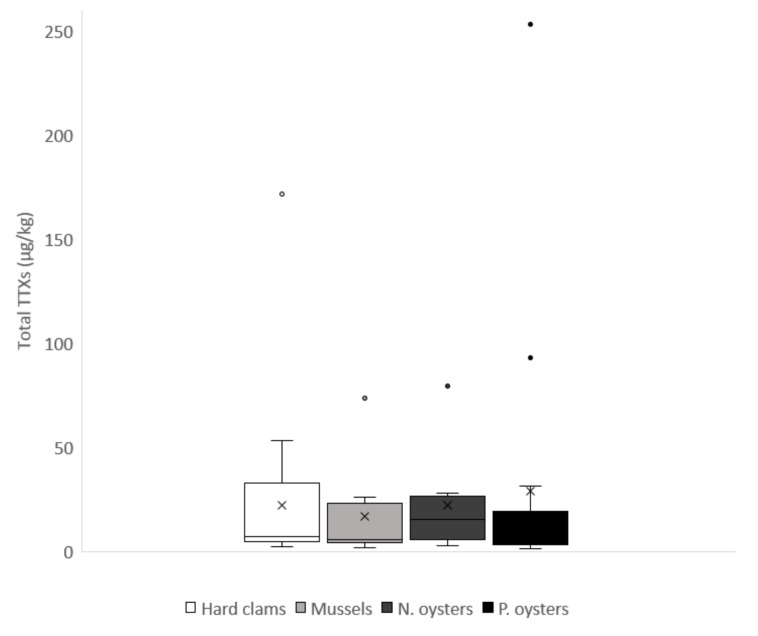
Figure 4.
Box and whisker plot illustrating TTX results (µg/kg) quantified >LOR for hard clams (n = 24), mussels (n = 9), native oysters (n = 8) and Pacific oysters (n = 16) from England (2014–2016). The box shows the distribution of the data into quartiles, the whiskers show variability outside the upper and lower quartiles, with points outside the whiskers considered outliers. The interquartile line highlights the median, with the X corresponding to the mean.

