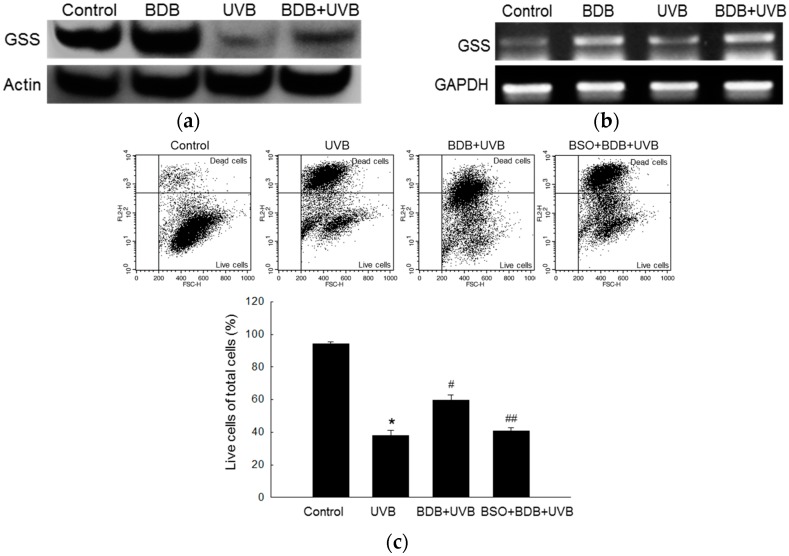
Figure 2.
Effects of BDB on GSS in UVB-exposed HaCaT cells. (a) Western blot assay and (b) RT-PCR analysis were performed to detect protein and mRNA levels of GSS, respectively; (c) The populations of live cells and dead cells were detected using flow cytometry after PI staining, and dot plots were generated. *, #, ## indicate significant differences from control, UVB, and BDB + UVB groups, respectively (p < 0.05).

