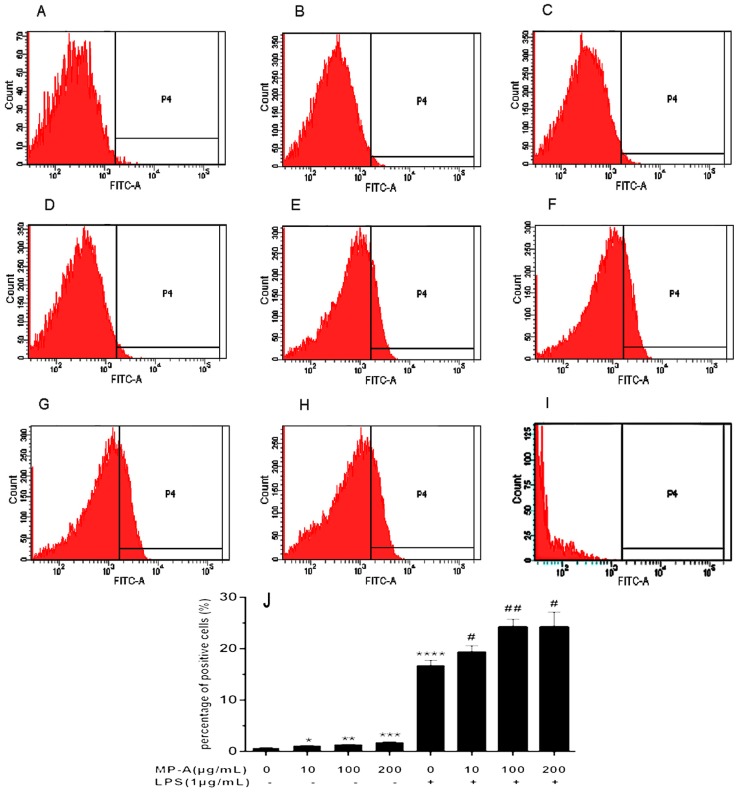
Figure 2.
Effect of MP-A on THP-1 cell phagocytosis. (A–H) Representative fluorescence activated cell sorter (FACS) plots (three independent experiments), showing phagocytosis of THP-1 cells treated with (A) vehicle only (control); (B) 10 μg/mL MP-A; (C) 100 μg/mL MP-A; (D) 200 μg/mL MP-A; (E) 1 μg/mL LPS; (F) 1 μg/mL LPS + 10 μg/mL MP-A; (G) 1 μg/mL LPS + 100 μg/mL MP-A; and (H) 1 μg/mL LPS + 200 μg/mL MP-A; (I) blank control (J) Statistical analysis of results shown in (A–H). * p < 0.05, ** p < 0.01, *** p < 0.001, and **** p < 0.0001 compared to control (MP-A) group; # p < 0.05, and ## p < 0.01, when compared to LPS group (n = 3).

