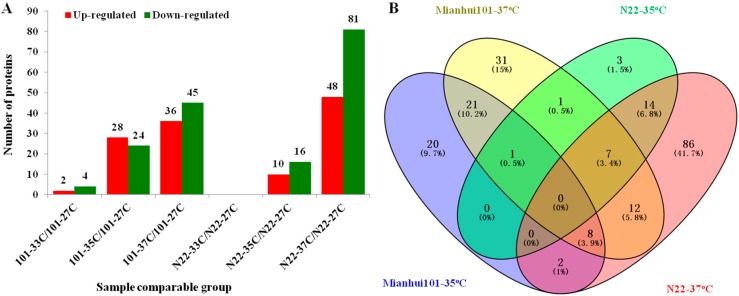
Figure 3.
Quantitative analysis of the proteome between the HS treated and control samples (A); and Venn analysis among the samples from different HS treatment of two rice cultivars (B). N22 and 101 stand for the two cultivars; 27C stands for the CK treatment; and 33C, 35C and 37C stand for different HS treatment.

