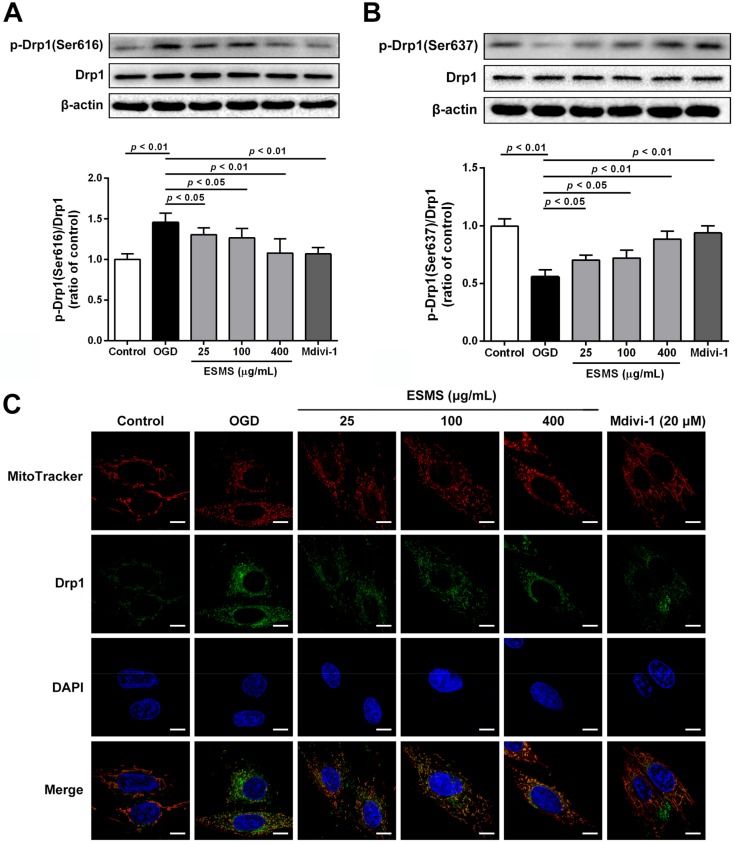
Figure 8.
ESMS regulated Drp1 phosphorylation, translocation in H9c2 cells subjected to OGD. (A) Drp1 and p-Drp1 (Ser616) proteins expression levels were determined using Western blot analysis (n = 3); (B) Drp1 and p-Drp1 (Ser637) proteins expression levels were determined by Western blot analysis (n = 3); (C) Mitochondrial localization of Drp1 was assessed under confocal laser scanning microscope (green). Mitochondrial morphology was stained with Mito Tracker® Deep Red FM (red). Nuclei were stained with 6-diamidino-2-phenylindole (DAPI) (blue). Differential interference contrast (DIC) images were also obtained. Bar is 10 μm (n = 3). Results were presented as mean ± SD.

