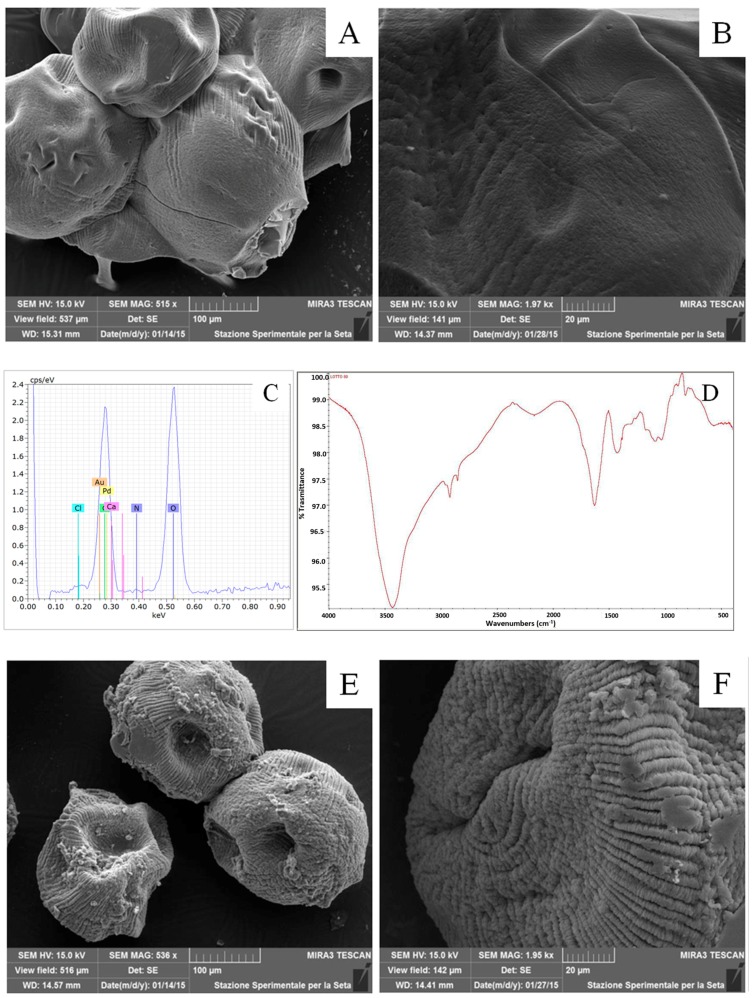
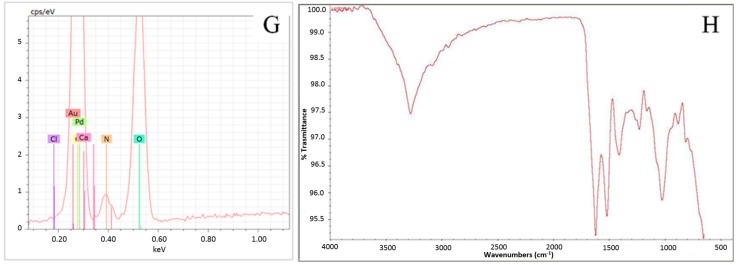
Figure 4.
Morphological and physico-chemical characterization of AMs (A–D) and FAMs (E–H). Scanning electron microscope (SEM) images: AMs smooth surface (A,B) and FAMs rough surface (E,F); energy dispersive X-ray (EDX) spectra: fibroin nitrogen peak in FAMs spectrum (G), and absence of the fibroin nitrogen peak in AMs spectrum (C); Fourier transform infrared spectroscopy (FTIR) spectra: (D) AMs calcium alginate peak stretching vibrations of O–H bonds in the range 3000–3600 cm−1, stretching vibrations of aliphatic C–H at ~2900 cm−1 and asymmetric stretching vibration of the carboxylate group at ~1600 cm−1 (D); (H) absorption bands of FAMs fibroin crystalline β-sheets conformation at ~1620 cm−1 for Amide I and ~1520 cm−1 for Amide II.


