Figure 6.
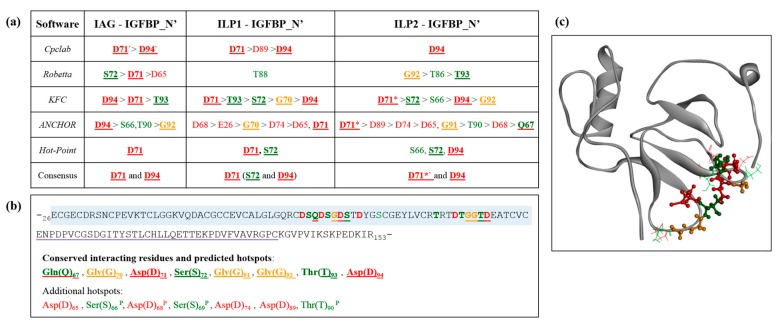
Identification of hotspot residues: (a) determined by five independent alanine scanning algorithms. Amino acids are shown in standard letter notation. Other notation is as follows: an asterisk (*) indicates the presence of a salt bridge predicted by PDBsum; a dash (`) a salt bridge predicted by Cpclab; bold underlined indicates residues that show a conserved binding interaction with all three ligands (see Figure 5b). (b) Illustration of Sv-IGFBP_N’ sequence (insulin-binding domain boxed in blue and kazal domain underlined in purple) highlighting the positioning of predicted hotspots. The eight consistently interacting hotspot residues are in bold underline. Additional predicted hotspots are also listed, with a P highlighting those residues that were predicted as consistently interacting residues by PRODIGY. (c) Structural illustration of Sv-IGFBP_N’ with conserved interacting hotspot residues highlighted in ball and stick and additional hotspots in stick. Throughout, red indicates negatively charged residues; green, neutrally charged; and orange, glycine. Note the neutral Gln(Q) has been underlined in red in (b) sequence and coloured red in (c) structure due to its role in stabilizing the overall negative charge through the formation of hydrogen bonds.

