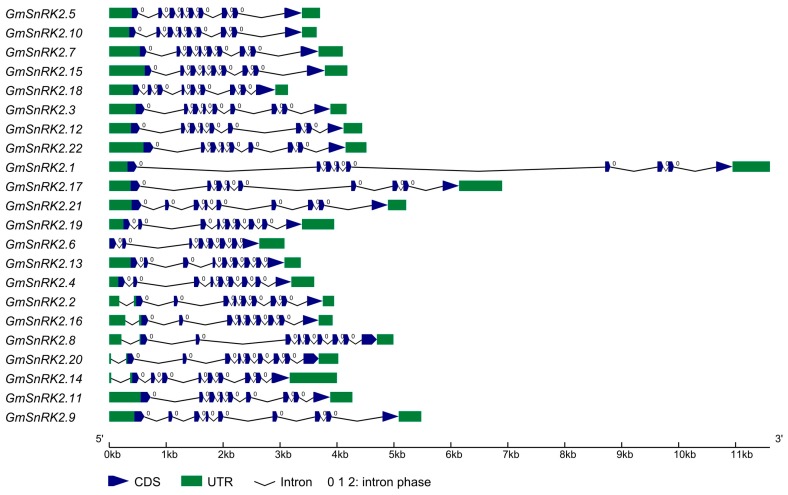
Figure 1.
Gene structure of GmSnRK2 genes. Introns are represented by black lines. Exons are represented by blue wedges. 5′ and 3′ untranslated regions (UTRs) are represented by green boxes. The intron phase is labeled above each intron. The scale of gene length is given at the bottom. CDS: Coding sequence.

