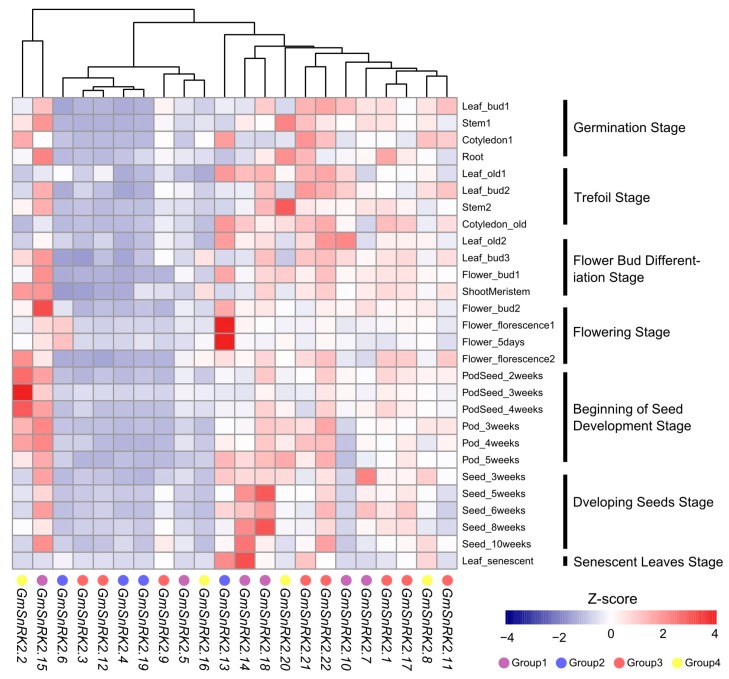
Figure 3.
Expression analysis of GmSnRK2s during growth and development of different tissues of soybean. The RNA sequencing (RNA-Seq) dataset of 28 tissues of soybean collected from different development stages were obtained from the National Center for Biotechnology Information (accession number: SRP038111) to generate heatmap. The color scale indicating Z-score value is given below. Group 1, Group 2, Group 3 and Group 4 are marked as purple, blue, red and yellow circles, respectively. The different stages are marked by vertical black lines.

