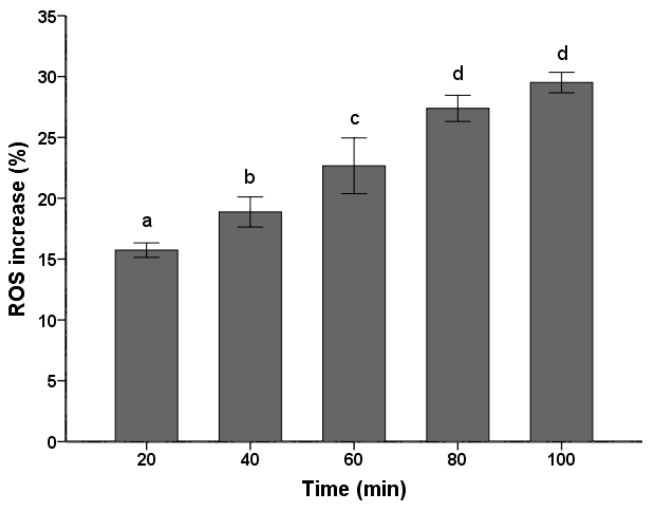
Figure 2.
Effects of the PSE on the increase of ROS in C. albicans cells. Cells were treated with 20 µg/mL extract for 20 to 100 min, stained with DCFH-DA (10 µM/L) for 15 min and analyzed by fluorescence. Fluorescence intensity is an indication of ROS levels in C. albicans cells. Data (n = 3) are expressed as mean ± SD. The statistical significant of differences was calculated using one-way ANOVA with Bonferroni’s post hoc test. Different letters represent significant difference (p < 0.05).

